Opening-up Melbourne again?
The incidence of COVID-19 across Melbourne marks a stark divide, with case numbers much more heavily concentrated in the north and west than in the south or east. What are the factors contributing to this spatial pattern? How can Melbourne ‘re-open’ in a way that tackles entrenched disadvantage?
Taking advantage of Cold Spots
The compounding disasters of bushfires, COVID-19 shutdown and economic depression are leading to a further disaster in the mental health of Victorians. There is increasing evidence of the growth in mental illness and reduced wellbeing in the State. This can be found in increased generalised anxiety and depression, and suicidal thoughts and behaviours, particularly in young people and other vulnerable populations. On-going social disconnection and prolonged social isolation, as well as greater levels of uncertainty about employment prospects, can exacerbate prior mental health issues as well as lead to the development of new conditions.
By the end of Stage 4 in Melbourne, people will be expecting the opportunity to live a close to normal life again and this will also be important for easing the growing levels of mental illness and reduced wellbeing, and for the turning the rising tide of unemployment. The longer Stage 4 continues, the more likely it seems that there will be a diminishing propensity to maintain lockdown, given growing weariness with isolation and restrictions, so easing as soon as practicable has much to commend it.
Re-opening businesses is central to Melbourne returning to ‘normal’. Hot spots have been used in trying to gain greater control over COVID spread and there is merit in thinking about a similar approach to unlocking: cold spots if you like. Such an approach has the benefit of enabling people in areas that, for whatever reason, have achieved lower numbers of COVID cases, to get earlier access to (near) normality, be they residents, workers, business owners and/or customers.
At Local Government Area (LGA) level, potential cold spots might be identified by comparing active case numbers to resident population. Active case numbers change daily, so numbers as published on 31/7, 7/8 and 14/8 were averaged to obtain ‘representative’ figures in the second wave, per LGA, as shown in Figure 1.
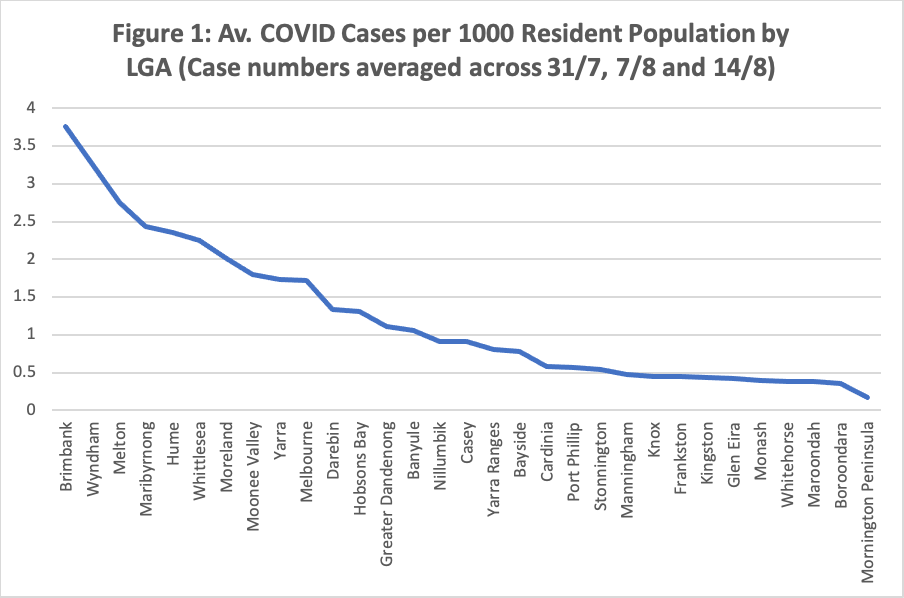
Sources: Active case numbers from https://covidlive.com.au/report/active-cases-by-lga; Population as at 30 June 2019 from ABS (2020).
The range in the data is large, underlining the point about hot spots and, equally, the opportunity to think about cold spots. Brimbank, Wyndham, Melton, Maribyrnong, Hume, Whittlesea and Moreland all had more than 2 active cases per 1000 resident population. These seven LGAs are all in the north or west of Melbourne.
Conversely, 17 LGAs averaged fewer than 1.0 active case/1000 population, with the lowest 16 all being in the south or east, joined then by Nillumbik in the north-east (and Banyule at just over 1 case/1000 population - also in the NE). This underlines how COVID is really a tale of two cities in Melbourne. The average number of active cases per LGA in the 12 NW LGAs was 370 across the three days, four times the average number per LGA in the SE (where there are 18 LGAs, City of Melbourne not being included as NW or SE in this regional comparison).
Influences on active case numbers
Prima facie, LGAs with the lowest case numbers would be candidates for early re-opening, provided Stage 4 substantially reduces overall numbers and these LGAs keep their numbers low. Looking to assess possible re-opening, however, should also include considerations other than just active case numbers relative to population size, considering (for example) factors that might be associated with higher/lower numbers. Thirty factors (for which census, population health, unemployment or other public data is readily available) were considered at LGA level, encompassing variables such as population, various age groups, job numbers, productivity, part-time employment rates, unemployment, area, density, (broad) land uses, social-economic disadvantage, trust, whether the main language spoken at home is English, education level, proportion of occupied dwellings that are separate houses, persons per dwelling, asthma, smoking and reported health. Eleven variables were significantly correlated with active case numbers at a 1% significance level: population (+ correlation), population growth rate 2011 to 2016 (+), English-only spoken at home (- correlation), population aged 80 or over (-), population aged 75 or more (-), population aged 65-79 (-), persons per dwelling (+), unemployment rate (+), SEIFA Index (-), smokers (+) and fair or poor health (+).
Multiple regression analysis suggested a model that retained only four significant explanatory variables (10% significance level), explaining 63.8% of the variance in numbers of active cases by LGA. Variables such as the unemployment rate and persons per dwelling dropped out, being significantly correlated with other retained variables. The four variables, with their estimated contributions are:
- Resident population - the number of active cases in an LGA was predicted to increase by 0.9 for each additional 1000 population
- Percentage of the population speaking English-only at home - a percentage point increase here is predicted to reduce the number of active cases by 5.3, highlighting the importance of language appropriate COVID messaging
- Percentage of the population aged 80 and over - a percentage point increase in the population in this age group is predicted to reduce the number of active cases by 52.7. There are not many percentage points in this age group (which accounts for 3.9% of Greater Melbourne’s population), so a one percentage point difference is substantial. This finding suggests good risk awareness in this vulnerable age group, notwithstanding the terrible impacts that have emerged in many care settings
- Percentage of the adult population who are smokers - a percentage point increase here is predicted to increase the number of active cases by 13.3, perhaps suggesting lower health risk awareness among adult smokers.
The model was used to identify relative performance by LGA, the LGAs with the most favourable difference between actual active case numbers and predicted numbers, given their characteristics in terms of the four explanatory variables, being Greater Dandenong (275 fewer than predicted), Casey (170 fewer), Monash (153 fewer), Frankston (106 fewer) and Knox (103 fewer). The least favourable LGAs were Wyndham (288 more), Brimbank (279 more), Moreland (125 more) and Moonee Valley (113 more). It would appear that residents in these LGAs are adopting good protective practices. These results again reflect the S/E and N/W divide.
The proportion of population speaking English-only at home, proportion of population aged 80 and over and proportion of the population who are smokers explain most of the difference in predicted case numbers between the NW and SE in the model. Model co-efficients were used to predict actual case numbers for a ‘typical’ NW and SE LGA, using weighted average values for each of the co-efficients across the NW and SE to derive these ‘typical’ LGAs. The model underestimated actual case numbers in the NW LGAs overall by about ten per cent and substantially overestimated numbers in the SE, such that the actual difference between the NW and SE that is ‘explained’ by the model is only a little over half. A little under half the actual difference in active case numbers between a typical NW LGA and one from the SE thus remains unexplained by the model, indicating a need to search more broadly for suitable (spatial) explanatory variables. Data on casual employment would be interesting but does not appear to be available.
Greater Dandenong is an interesting case. In the model (with the four explanatory variables) it is rated the best performing LGA but is only mid-range in Figure 1. This implies good performance in terms of numbers of active COVID cases, given the LGA’s characteristics. For example, Greater Dandenong has the lowest proportion of households where English-only is spoken at home, which predicts relatively high numbers. The relatively low numbers of active cases reflect well on the community. There should be lessons here.
Re-opening
Looking to a brighter future post Stage 4, the sooner that Victoria can re-open the better. This will improve economic health and promote individual and community wellbeing. Ideally the entire State of Victoria will be able to re-open for business at the same time. While this article has concentrated on Melbourne, similar issues arise in regional Victoria, where there is high youth unemployment and high levels of social disconnectedness. Levels of suicide deaths, self-harm (resulting in hospitalisation) and presentation at emergency departments are at risk of dramatically increasing in some areas, such that there may be increases in suicides in regions of Australia up to 10 percentage points higher than the national average over the next 5 years.
If substantial spatial disparities in incidence persist, then there is a case to look at a possible staged re-opening, supporting better outcomes at an earlier time in the lower risk parts of the metropolitan area (and regional Victoria). This would be likely to require a means of limiting activity catchments for the re-opened areas to residents of those areas.
Based on Figure 1 and the modelling undertaken for this article, the most likely current candidate LGAs for early re-opening in Melbourne would be Local Government Areas in the east, south and north-east (Nillumbik and Banyule). This could change in coming weeks, depending on trends in incidence.
Tackling spatial disadvantage
The analysis demonstrates the inequities in COVID incidence across Greater Melbourne, with the north and west bearing the brunt of the disease. This again confirms our knowledge that economic downturns, and now pandemics, do not affect all groups equally, especially hard hit being those employed in casual work, those without accumulated assets and those who have not established independent social networks. These groups are often younger people. There is a high risk that, without special attention to this group, there will be growth in inter-generational inequality. Spatial inequity has been highlighted in this paper.
Staged re-opening, if required, poses risks of continuing, and even accentuating for a short time, the spatial disadvantage that has long been experienced by LGAs in the north and west of Melbourne, relative to the east and south. This spatial disadvantage should be tackled head-on, with resources channelled in coming weeks into the north and west, to accelerate return to normal from COVID, including a focus on messaging in languages other than English (among other things) and on people who are less health conscious. An approach along these lines will, ideally, remove any need for staged re-opening but will also minimise risks of adding to disadvantage, should staging be considered.
Longer term, increased resources should be devoted to ensuring that entrenched disadvantage in the north and west of Melbourne is removed. Regional development bodies, such as Northlink, have assembled comprehensive priority lists that will assist here. For example, rather than starting to build a Suburban Rail Loop in Melbourne’s south-east, which will further disadvantage the north (e.g. La Trobe University), the State Government should immediately improve Medium Capacity Transit in the north, connecting to the east, south and west (e.g. SmartBus, Bus Rapid Transit, light rail). This will boost regional accessibility, productivity and all that flows therefrom.
One very important lesson from this pandemic is that, as a society, we need to move away from blaming individuals as being solely responsible for their disadvantaged conditions, in terms of (for example) unemployment, early school leaving, and low wellbeing. The pandemic reveals that it is often the lack of opportunities that perpetuates disadvantage, where resources are not evenly distributed between people and places. In this sense, COVID compounds existing disadvantage, including in many fast-growing outer suburbs, where population growth has run ahead of provision of the requisite infrastructure and services.
A comprehensive strategy to tackle entrenched disadvantage should be one legacy from COVID in Melbourne. To improve long term social resilience and wellbeing, COVID has reminded us that there is a social gradient of impact/harm, with the poorer suburbs hurt more. Addressing disadvantage is a matter of social justice, but is also, as Stiglitz (2012) reminds us, a strategy of enlightened self-interest for the rest of the community.
AUTHORS
John Stanley is an Adjunct Professor in the Institute of Transport and Logistics Studies at the University of Sydney Business School.
Associate Professor Janet Stanley is a Principal Research Fellow in Urban Social Resilience at the Melbourne Sustainable Society Institute, at the University of Melbourne.